Hey there, future Google rockstar! If you’re eyeing a data role at Google—be it Data Analyst, Data Scientist, or Data Engineer—you’ve probably heard the whispers: SQL interviews at Google are no joke. But don’t sweat it! I’m here to break it all down for ya, share some insider tips, and walk you through the kinda questions Google loves to throw at candidates. We’re gonna dive deep into what makes these interviews tick, with real-world examples and tricks to help you shine.
SQL or Structured Query Language is the backbone of data work at Google. They’ve got insane amounts of data—think trillions of searches and ad clicks—so they need folks who can wrangle that info like a pro. Whether you’re analyzing user behavior or optimizing ad campaigns, SQL is your go-to tool. And trust me, Google’s gonna test your chops hard to see if you can handle their scale. So, let’s get into the nitty-gritty of Google SQL interview questions and how you can prep to nail ‘em!
Why SQL Matters at Google (And Why They Grill Ya On It)
Before we jump into the questions, let’s chat about why SQL is such a big deal at Google They ain’t just lookin’ for someone who can write a basic query Nah, they want peeps who can think critically, solve messy problems, and handle data at a scale most of us can’t even imagine. Here’s the lowdown
- Massive Data Volumes: Google processes billions of searches, ad impressions, and user actions daily. SQL helps slice and dice that data for insights.
- Real-World Impact: Your queries might power a Super Bowl ad stat or optimize Google Maps content. Stakes are high!
- Cross-Role Relevance: Whether you’re in analytics, science, or engineering, SQL is a must. Even with fancy AI tools, they still test it hardcore.
I remember preppin’ for my own tech interviews back in the day, and lemme tell ya, SQL was the one thing I couldn’t skip. Google’s all about practical skills, so expect scenarios straight outta their playbook—think search frequency or ad click-through rates. Now, let’s dig into the types of questions they’ll hit ya with
Types of Google SQL Interview Questions You’ll Face
Google’s SQL questions usually ain’t your run-of-the-mill “SELECT * FROM table” stuff. They’re designed to test how you think, not just what you know. Based on what I’ve seen and heard from folks who’ve been through the ringer, here’s the kinda challenges you’re up against. I’ve grouped ‘em into themes to make it easier to wrap your head around.
1. Aggregation and Stats: Crunchin’ Numbers Like a Boss
Google loves to see if you can summarize data with aggregates—think sums, averages, medians, and counts. These often pop up in marketing or user behavior scenarios. A classic one I’ve come across is calculating the median number of searches per user for a big TV ad campaign. Sounds simple, right? But at Google’s scale, you gotta be clever.
Example Problem: Imagine you’ve got a table showing how many searches users made last year, with a column for the number of searches and another for how many users fall into that bucket. Your job? Find the median search count, rounded to one decimal.
How to Think It Through:
- First, ya gotta figure out the total number of users to find the middle point.
- Then, sorta build a cumulative count of users across search buckets until you hit that middle.
- If it falls between two values, average ‘em out. Easy peasy (well, kinda).
Here’s a lil’ table to visualize the data:
| Searches | Num_Users |
|---|---|
| 1 | 2 |
| 2 | 2 |
| 3 | 3 |
| 4 | 1 |
If you crunch this, the median comes out to 2.5. Google might throw in a twist, like a huge dataset, so think about efficiency too!
2. Time-Based Analysis: Slicin’ Data by Date
Another fave of Google’s is time-series stuff. They wanna know if you can group data by day, month, or year and pull meaningful insights. Think about ad performance or user activity over time.
Example Problem: Say you’ve got sensor measurements from multiple days, with each day havin’ several readings. Google asks ya to sum up odd-numbered and even-numbered measurements separately for each day.
Breakdown:
- Group the data by the day part of the timestamp.
- Figure out if a measurement’s ID is odd or even (maybe using a row number or ID).
- Sum the values in two columns: one for odd, one for even.
Here’s what the output might look like:
| Measurement_Day | Odd_Sum | Even_Sum |
|---|---|---|
| 07/10/2024 00:00:00 | 2355.75 | 1662.74 |
| 07/11/2024 00:00:00 | 1124.50 | 1234.14 |
This tests if you can handle dates and conditional logic in SQL. Pro tip: Brush up on functions like ROW_NUMBER() or modulo to split odd and even rows.
3. Joins and Relationships: Connectin’ the Dots
Google’s data ain’t sittin’ in one neat table. You’ll often need to join multiple tables to get the full picture—like linkin’ ad clicks to conversions or user searches to categories. They’re testin’ your grasp of relationships and referential integrity.
Example Problem: Suppose you’re analyzin’ Google Shopping ads. You’ve got one table for ad clicks and another for cart additions. Your task? Calculate click-through rates (CTR) and conversion rates per ad.
Approach:
- Join the clicks and cart tables on ad ID and user ID.
- Count total clicks per ad for CTR.
- Count cart additions per ad, then divide by clicks for conversion rate.
This one’s all about JOINs—inner, left, whatever fits—and groupin’ with GROUP BY. Google might sneak in a curveball, like missin’ data, so watch out for nulls!
4. Categorization and Rankings: Who’s on Top?
Ever wonder how Google decides what’s hot in search trends? They’ll test ya on categorizin’ data and rankin’ stuff, often usin’ window functions or complex groupin’.
Example Problem: You’ve got search data with categories (like “Recipes” or “Stock Market”) and dates. Google wants the total searches per category per month in 2024.
How to Tackle It:
- Join the search table with a category lookup table.
- Extract the month from the date (use somethin’ like
EXTRACT(MONTH FROM search_date)). - Group by category and month, then count searches.
Output might be:
| Category_Name | Month | Total_Searches |
|---|---|---|
| Recipes | 06 | 2 |
| Stock Market | 06 | 1 |
| Programming Tutorials | 07 | 1 |
This checks if you can handle multi-level grouping and time filters. I’ve messed up on these before by forgettin’ to filter the year—don’t make that mistake!
5. Optimization and Troubleshooting: Speedin’ Things Up
If you’re gunning for a Data Engineer spot, Google’s gonna ask about makin’ queries faster. They deal with crazy data volumes, so a slow query ain’t gonna cut it.
Example Question: You’ve got a super slow SQL query. How do ya figure out what’s draggin’ it down, and how do ya fix it?
My Take:
- Use tools like
EXPLAIN PLANto see where the bottleneck is—maybe a full table scan. - Add indexes on columns used in
WHEREorJOINs, but don’t overdo it ‘cause updates slow down. - Rewrite subqueries as joins if possible. I’ve seen queries cut runtime in half with this trick!
This ain’t just syntax—it’s about thinkin’ like an engineer. Google wants problem-solvers, not just coders.
6. Conceptual Stuff: Knowin’ the Why Behind SQL
Google don’t just want code monkeys; they wanna see you get the big picture. Expect questions on database design or SQL concepts.
Example Question: What’s denormalization, and why would ya use it?
Quick Answer:
- Denormalization is when ya break normalization rules (like 1NF, 2NF) to boost performance.
- Ya duplicate data to cut down on joins, which speeds up reads for reports or analytics.
- Downside? More redundancy and trickier updates. It’s a trade-off!
I’ve had interviewers ask me to explain foreign keys or stored procedures too. Once, I flubbed a foreign key answer by ramblin’—keep it short and sweet.
Deep Dive: A Few Full-On Examples to Practice
Alright, let’s get hands-on with a couple detailed problems. I’m pickin’ ones that cover different skills so you can flex your SQL muscles. Grab a coffee, ‘cause we’re goin’ in!
Problem 1: Median Search Frequency for a Super Bowl Ad
Scenario: Google’s marketing team needs a stat for a Super Bowl commercial—the median number of searches per user last year. You’ve got a summary table with search counts and user counts per bucket.
Sample Data:
| Searches | Num_Users |
|---|---|
| 1 | 2 |
| 2 | 2 |
| 3 | 3 |
| 4 | 1 |
Goal: Find the median, rounded to one decimal (output: 2.5).
Solution Walkthrough:
- Total users = 8, so median is between the 4th and 5th user.
- Build a cumulative count: 1-search (2 users), 2-search (4 users), 3-search (7 users).
- 4th user is at 2 searches, 5th is at 3 searches. Average ‘em: (2 + 3)/2 = 2.5.
SQL Snippet:
SELECT ROUND(AVG(searches * 1.0), 1) AS medianFROM ( SELECT searches FROM search_summary s CROSS JOIN LATERAL generate_series(1, num_users) ORDER BY searches LIMIT 2 OFFSET (SELECT COUNT(*) / 2 FROM search_summary CROSS JOIN LATERAL generate_series(1, num_users))) sub;Okay, that’s a bit fancy. Point is, ya gotta think about expandin’ the data logically. Practice this one—it’s a brain teaser!
Problem 2: Ad Campaign Performance Metrics
Scenario: You’re on Google’s advertiser solutions team, analyzing ad campaigns. You’ve got a table of clicks with costs and need average cost per click (CPC) per campaign and ad group.
Sample Data:
| Click_ID | Date | Campaign_ID | Ad_Group_ID | Clicks | Cost |
|---|---|---|---|---|---|
| 4325 | 06/08/2024 | 1302 | 2001 | 50 | 100.00 |
| 4637 | 06/10/2024 | 1403 | 2002 | 65 | 130.00 |
Goal: Output CPC (total cost / total clicks) per campaign and ad group.
Solution:
- Group by
campaign_idandad_group_id. - Sum cost and clicks, then divide.
SQL Snippet:
SELECT campaign_id, ad_group_id, ROUND(SUM(cost) / SUM(clicks), 2) AS avg_CPCFROM ad_clicksGROUP BY campaign_id, ad_group_idORDER BY campaign_id, ad_group_id;This one’s simpler but tests precision. I’ve seen peeps forget to round—don’t be that guy!
How to Prep for Google SQL Interviews (My Best Tips)
Now that we’ve covered the meat of the questions, let’s talk strategy. I’ve been there, stressin’ over interviews, and here’s what helped me (and pals who’ve landed Google gigs).
- Practice, Practice, Practice: Don’t just read queries—write ‘em! Use online platforms to code SQL hands-on. Make mistakes, fix ‘em, learn.
- Understand the Why: Google ain’t just testin’ syntax. They wanna know why ya chose a join over a subquery or an index over a full scan.
- Mock Interviews: Grab a buddy or use a service to simulate the real deal. I bombed my first mock ‘cause I froze—don’t let that be you.
- Brush Up on Basics: Joins, group by, window functions, indexes—know ‘em cold. I’ve seen folks trip on simple stuff under pressure.
- Think Out Loud: In the interview, walk ‘em through your logic. Even if ya mess up, they’ll see how ya think. I’ve saved myself this way!
Oh, and a lil’ secret: Google interviewers are often cool if ya don’t know everything, as long as you’re honest and eager to learn. Don’t try to fake it—trust me, they’ll catch ya.
Common Mistakes to Avoid (I’ve Made ‘Em, So You Don’t Have To)
I’ve screwed up plenty in SQL prep, and I’ve seen others do the same. Here’s a heads-up on pitfalls:
- Overcomplicatin’ Queries: Keep it simple, stupid! I once wrote a nested mess when a single join woulda worked.
- Ignorin’ Edge Cases: Nulls, duplicates, empty tables—Google loves throwin’ these at ya. Test your code with weird data.
- Not Explainin’ Your Work: If ya don’t talk through your approach, they might think ya guessed. I learned this the hard way.
- Skippin’ Optimization: Even if it runs, ask yourself, “Could this be faster?” Google cares about scale.
Pro tip: After writin’ a query, double-check it with a small dataset. I’ve caught dumb errors this way, like forgettin’ a filter.
Mindset: Stayin’ Cool Under Pressure
Look, Google interviews are tough, and it’s easy to feel like ya ain’t good enough. I’ve been there, thinkin’ I’d never make the cut. But here’s the real talk: it’s just a convo about data. They’re not out to get ya—they wanna see how ya solve problems.
Take a deep breath before the interview. If ya don’t know somethin’, say, “I’m not sure, but here’s how I’d figure it out.” I’ve turned a weak moment into a strength by showin’ curiosity. And hey, even if ya don’t get the gig, each interview makes ya sharper for the next one.
Wrappin’ It Up: You’ve Got This!
Whew, we’ve covered alot of ground, from the types of Google SQL interview questions to hands-on examples and prep tips. Whether it’s calculatin’ medians for a Super Bowl ad or optimizin’ ad campaign queries, Google’s lookin’ for folks who can think on their feet and handle big data challenges. With the right practice and mindset, you can walk into that interview room (or Zoom call) feelin’ like a champ.
I’d love to hear from ya—what’s the trickiest SQL problem you’ve faced? Drop a comment below, and let’s swap war stories. And if this helped, share it with a pal who’s also chasin’ that Google dream. Keep grindin’, and I’ll be rootin’ for ya to crush it!

SQL Query to Find Users with High Click Volume
Given a user_clicks table containing users data, the task is to Find users who have clicked more than 3 times.
Table: user_clicks
user_id |
timestamp |
page_id |
action_type |
|---|---|---|---|
| 1 | 2024-06-18 08:30:00 | 101 | “click” |
| 2 | 2024-06-18 08:31:00 | 102 | “click” |
| 1 | 2024-06-18 08:32:00 | 103 | “click” |
| 3 | 2024-06-18 08:33:00 | 101 | “click” |
| 1 | 2024-06-18 08:34:00 | 101 | “click” |
| 1 | 2024-06-18 08:35:00 | 102 | “click” |
| 2 | 2024-06-18 08:36:00 | 103 | “click” |
| 3 | 2024-06-18 08:37:00 | 104 | “click” |
| 3 | 2024-06-18 08:38:00 | 105 | “click” |
| 3 | 2024-06-18 08:39:00 | 106 | “click” |
| 1 | 2024-06-18 08:40:00 | 107 | “click” |
| 2 | 2024-06-18 08:41:00 | 108 | “click” |
| 1 | 2024-06-18 08:42:00 | 109 | “click” |
Query:
Output:
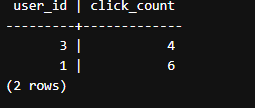
Explanation: This query calculates the click count for each user (user_id) in the user_clicks table, grouping the results by user_id. The HAVING clause filters the groups to include only those with a click count (click_count) greater than 3.
Write a Query to Find the Number of Pages That are Currently Active and have the Latest Event
Given a table pages with columns page_id, status, and event_date, write a SQL query to count the number of active pages that have the latest event date among all events for each page. An active page is defined as a page with status = active. Consider each row in the pages table as a single event for a page.
Table: pages
| page_id | page_name | status | event_date |
|---|---|---|---|
| 1 | Home | active | 2022-06-01 |
| 2 | About Us | active | 2022-05-30 |
| 3 | Contact Us | active | 2022-06-02 |
| 4 | Products | active | 2022-05-29 |
| 5 | Services | active | 2022-06-03 |
Query:
Output:

Explanation:This query counts the number of active pages (`status = active`) that have the latest event date (`event_date`) among all events for each page. It uses a correlated subquery with `NOT EXISTS` to check if there are no other events for the same page (`p2.page_id = p1.page_id`) with a later `event_date`. If there are no such events, the page is considered to have the latest event date.
How to PASS SQL Interviews? Data Science Tips⚡
0